
Executive dashboards & performance reporting
Reporting that shows leadership progress, risk, and the decisions waiting on it, with every number traced to its source and its owner.
When this is the work
Signs executive reporting needs rebuilding.
A report is only useful if it arrives in time to change a decision. Most reporting problems are problems of definition and ownership before they are problems of tooling.
- Reports arrive after the meeting they were built for.Decisions are made from memory and the report becomes an archive.
- Two reports answer the same question differently.Meetings are spent reconciling numbers instead of acting on them.
- Dashboards show activity, not progress.Everything looks busy and nothing shows whether the objective is moving.
- No one owns the measures.Definitions drift, and a red number has no one to answer for it.
- Building the monthly pack takes days of manual work.Skilled staff spend their time assembling slides instead of analyzing them.
- The stuck decision is not on the page.Leadership sees the symptom but not the decision that would resolve it.
What it includes
What the work can include.
Every engagement is scoped in writing. We can rebuild executive reporting end to end, fix measure definitions and data ownership behind existing dashboards, or automate a reporting cycle your team already runs.
Measure design
Measures tied to objectives, with definitions, targets, thresholds, and owners agreed before anything is built.
Data sources and lineage
Every measure traced to a source of record, with a refresh schedule and a visible as-of date.
Executive dashboards
Power BI or Tableau dashboards built around the questions leadership asks, with drill-down to the work behind each number.
Board and committee reporting
Standard packs for board, committee, and steering meetings, built from the same governed data, with review controls kept.
Decision tracking
Open decisions, owners, and due dates reported beside the measures they affect, so the stuck decision is visible.
Reporting automation
Manual assembly replaced with automated refresh and distribution, so analysts spend their time on analysis.
Reporting cadence
Weekly, monthly, and quarterly reviews with defined inputs and recorded outputs.
- Measured by
- Reporting lag
- Reconciliation effort
- Decisions made on current data
- You keep
- A measure catalog
- Owned data sources
- A reporting cadence your team runs
A working example
An executive dashboard leadership can inspect.
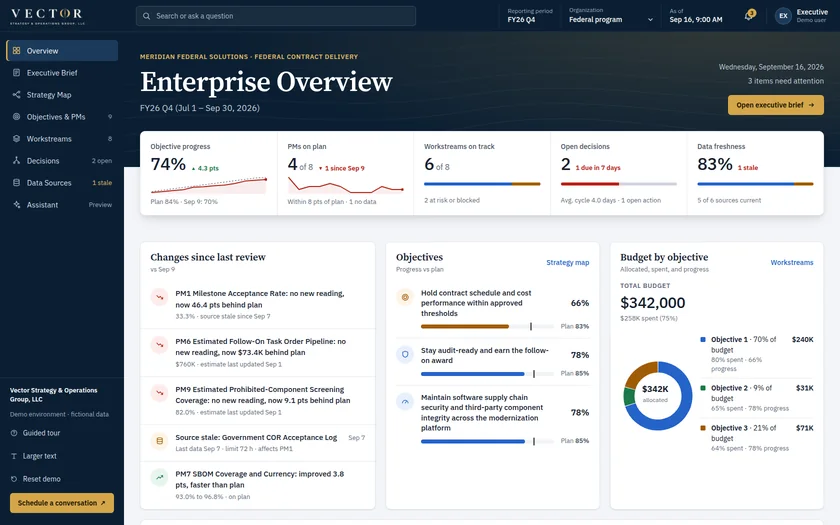
The live example connects each objective to the measures that show whether it is moving, the workstreams responsible, the decisions they are waiting on, and the source behind every number.
How it runs
Stages and outputs.
Define
Agree the questions leadership needs answered, the measures that answer them, and the owner of each measure.
OutputA measure catalog with definitions and owners
Connect
Trace each measure to its source of record, fix the highest-value gaps, and set refresh schedules.
OutputOwned data sources with visible as-of dates
Build
Build the dashboards and packs with the people who will use them, and test them in real meetings.
OutputDashboards and packs in use
Run
Automate the cycle, set the review cadence, and hand ownership to your team.
OutputA reporting rhythm your team runs
Questions
Executive reporting questions.
Should executive dashboards be built in Power BI or Tableau?
Whichever your organization already licenses and supports. Measure design and data ownership matter more than the tool, and both are settled before anything is built.
Can we start executive reporting if our data is messy?
Yes. Each measure shows its source, owner, and freshness, so gaps are visible instead of hidden. Fixing the highest-value sources becomes part of the plan.
Can we see an example executive dashboard?
The live operating picture shows how objectives, measures, workstreams, decisions, and evidence connect. It uses fictional organizations and simulated data connections.
Who maintains the dashboards afterward?
Your team. Each dashboard is handed over with documentation, a measure catalog, and a named owner for every data source.
Not sure this is the right starting point?
The Operating Diagnostic is a three-week, fixed-fee look at how the work actually runs. It tells you whether the fix is a process, a decision, a system, or all three, and gives you an action plan either way.